
Baseball coaching has always depended on the eyes. From watching the swing to watching the footwork, a great coach can catch lingering form problems that most people would miss.
But what happens when the sharpest eye reaches its limits? The eye can’t tell you the speed of movement at contact or measure spin rate. All of these statistical details matter when improving your game, and that’s why the best coaches work with instinct and data to sharpen their coaching approach.
At Lone Star Diamond Academy, we take that exact approach. Every hitter and pitcher trains with real performance metrics tracked week after week. The numbers don’t replace the coaching, but give it more guidance. Here’s what that looks like in practice and why it produces better results for Dallas-area players at every level.
What Data-Driven Training Actually Means
Data-driven training is not about gadgets. It’s about building a feedback loop that makes every rep more useful than the last.
Traditional instruction works something like this: a coach watches a player, offers a cue, the player tries to apply it, and everyone hopes it worked. That process can take weeks to confirm or correct. A player might feel like they improved. They might actually have gotten worse. Without objective measurement, it’s hard to know.
A data-driven feedback loop changes that process. Measure the current state. Make an adjustment. Retest. If the number moved in the right direction, the adjustment worked. Suppose it didn’t; change course. That cycle happens within a single session at LSDA, not over weeks of guesswork.
The result is faster development. Players stop spending months repeating the same mistake because nobody caught it in the numbers. Coaches stop chasing what looks good and start chasing what the data confirms is good. For youth baseball players in the Dallas area competing in one of the most talent-rich baseball markets in the country, that speed of development matters.
Key Metrics for Hitters
Three numbers tell most of the story for a hitter’s development. Understanding what they measure and how they connect to results is the first step toward using them.
Exit Velocity
Exit velocity is how fast the ball comes off the bat at contact. It’s the most direct measurement of how hard a hitter is hitting the ball. Harder contact gives the defense less time to react, produces more distance on fly balls, and leads to better outcomes across a full season.
A player’s average exit velocity over a session is a clean read on where their swing is right now. Watching that number trend upward over weeks and months is how you know real development is happening, not just a good day in the cage.
Launch Angle
Launch angle is the degree at which the ball leaves the bat. Too low and the ball is a weak grounder. Too high and it’s an easy fly ball. The productive range sits in the middle, and where a hitter consistently lands in that range tells a coach a lot about what’s happening in the swing.
Launch angle connects mechanics directly to results. A player who is consistently hitting the bottom of the ball and producing weak pop-ups is showing a mechanical tendency that shows up in the launch angle data before it shows up in a batting average.
Bat Speed
Bat speed measures how fast the barrel is moving at contact. It drives exit velocity directly, and it responds to the right training over time. At LSDA, HitTrax baseball training tracks exit velocity and contact data on every swing, giving coaches and players a real-time picture of where things stand and how they’re moving. That session-to-session record is what separates genuine improvement from a player who just happened to have a good afternoon.
Key Metrics for Pitchers
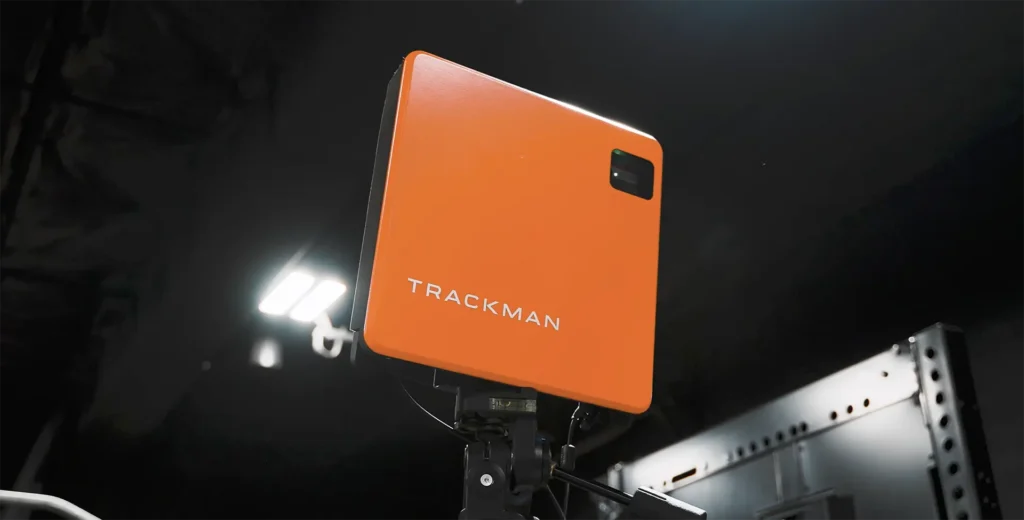
For pitchers, the data picture is different but equally revealing. Rapsodo baseball training measures the numbers that tell a pitcher who they are on the mound and what their stuff is actually doing.
Velocity Trends
Velocity trends are the starting point. Raw velocity matters, but trends matter more. A pitcher who is gaining velocity over a training cycle is developing correctly. One whose velocity is dropping late in sessions or across weeks might be dealing with fatigue, mechanical breakdown, or arm health issues that need attention before they become serious. Tracking velocity over time catches those patterns early.
Spin Rate
Spin rate measures how many times a baseball rotates per minute in flight. Combined with spin axis, which tells you which direction the ball is spinning, these two numbers explain why a pitch moves the way it does. A curveball with a high spin rate on the right axis breaks sharply. One with the same velocity but poor spin efficiency doesn’t. A pitcher who understands their own spin profile can build their arsenal with purpose instead of just throwing pitches and hoping they work.
Command and Consistency
Command and consistency data round out the picture. A pitcher who can light up a radar gun but can’t locate a fastball in a two-strike count is a limited weapon. Rapsodo tracks release point consistency, pitch movement repeatability, and how well a pitcher is executing their delivery across a full session. That information tells coaches exactly where to focus mechanical work.
Arm health fits into the data picture too. At LSDA, the goal is never just to chase velocity. It’s to build pitchers who throw hard, throw accurately, and stay on the mound. Data that shows release point drifting or velocity declining in a predictable pattern gives coaches an early signal to address workload or mechanics before an injury forces the conversation.
From Data to Development: How LSDA Applies It
Numbers on a screen don’t fix a swing or sharpen a pitcher’s approach. The coaches do that. What the data does is point them in the right direction faster and keep the plan honest over time.
Every athlete at LSDA trains on an individualized development plan built around their own metrics. A hitter with high bat speed but a pull-heavy spray chart needs a different focus than one with a good launch angle but limited exit velocity. A pitcher with elite spin rate on their curveball but inconsistent release point needs a different emphasis than one with average stuff and sharp command. The data tells that story clearly, and the plan reflects it.
Video analysis runs alongside the numbers at LSDA. HitTrax biomechanics pairs high-speed video with ball-flight data to study the full kinetic sequence of a swing. Rapsodo captures release mechanics and pitch shape in a way that lets coaches connect what a pitcher feels to what the ball is actually doing. When a player says a mechanical cue isn’t working, the video and the data together show why.
Coaches at LSDA, including director Cameron Dobbs, former Phillies draft pick Hunter Markwardt, and Tampa Bay Rays draftee Chris Muller, translate all of that raw information into coaching cues a player can feel and apply. A spin rate number doesn’t help a 15-year-old unless a coach can explain what it means for how they should grip and release the baseball. That translation is where playing experience at a high level earns its place in the program.
Weekly tracking means players and parents can see the trendline, not just one session. A player who improved their average exit velocity by four miles per hour over six weeks has a visible, provable record of development. That accountability changes the training environment. Players take the work more seriously when the numbers are watching.
Why This Approach Produces Better Game Results
Development that shows up in data tends to stick. When a player understands why an adjustment works, not just that it felt better in the cage, they can repeat it under pressure. A hitter who knows their exit velocity climbed when they fixed their hip rotation has a concrete connection between the mechanical change and the result. That knowledge holds up in a game situation in a way that a feel-based adjustment often doesn’t.
Confidence is another product of visible progress. Youth baseball players in Dallas, TX, competing at the high school level or preparing for showcases and recruiting events carry themselves differently when they know their numbers are moving in the right direction. A player who has watched their spin rate climb over a training cycle trusts their curveball in a way that pure repetition doesn’t always build.
For players targeting varsity rosters, summer showcases, or college recruitment, data-backed development also tells a more compelling story. A player who can show a measurable exit velocity improvement over a training period, or a documented velocity gain paired with spin data, is presenting something concrete to evaluators. That’s a different conversation than showing up and hoping the eye test lands in their favor.
Excel Through Data and Professional Coaching With Lone Star Diamond Academy
Data doesn’t replace great coaching. It makes great coaching more precise. The eye test built the game, and it still matters at LSDA. But pairing coaching instinct with objective metrics removes the guesswork from development and replaces it with a process that produces real, trackable results.
For DFW baseball families ready to see their player’s actual numbers and build a plan around them, Lone Star Diamond Academy is a baseball training academy in Dallas where that process is already running. Schedule an evaluation or explore our hitting and pitching lesson pages to see how data-driven development works from the first session forward.